Politics by numbers
In
Login if you are already registered
(no votes) |
(0 votes) |
Interview
The mathematical and statistical methods of quantitative data analysis are essential tools for political analysis in the U.S. - the birthplace of the academic discipline of political science. While in Russia a quantitative approach hasn’t spread its wings yet. In this interview John Freeman, former President of the American Political Science Association's Section for Political Methodology, talks about the use of quantitative methods for assessing the probability of armed conflicts. Professor Freeman focuses his research on developing a technology to forecast conflicts in the Middle East, South Asia, and East Asia. Isn’t it a perfect opportunity to learn some new ways of conducting research and interpreting information?
Interviewee: John Freeman, Distinguished Professor of political science at the University of Minnesota
Interviewer: Maria Prosviryakova, RIAC
Professor of political science
at the University of Minnesota
Our contemporary world is like a powder keg as violent conflicts continually break out in various parts of it. Yet it is not impossible to predict the probability of armed conflict and then try to avert it. And when I say “predict” I don’t mean an educated guess, I mean real science behind the prediction – mathematics. Professor Freeman, what quantitative method could be used to predict the probability of armed conflicts?
It would depend whether one wanted to study conflict onset - that is an outbreak of a conflict - as opposed to actual dynamics of a conflict. There are many new works now being done by people in Norway and elsewhere that use things like dynamic count models – models that use quantitative data that arises from counting, rather than ranking - to study conflict outsets. As far as conflict dynamics I would recommend things like Bayesian vector autoregression and events data analysis.
Bayesian Vector Autoregression (BVAR)
Bayesian VAR is used to determine the dynamics among time series (sequences of values taken by a variable over defined periods of time). The dynamics of military spending in nation-states can serve as an example of time series. Bayesian VAR can be used to measure conflict intensity, allowing the parameter estimates to change over time. As well this approach can be helpful in determining the nature of this change.
Bayes’ Theorem
The theorem provides a way to calculate how new information is consistent with the previous knowledge about the matter.
Events data analysis is a method of measuring events that helps to make sense of them by analyzing them in a statistical framework. For example, it can help see the dynamics of relationships between countries over time, determine the level of cooperation and conflict between them. Events data analysis offers a scientific interpretation of world phenomena.
The information for event data analysis is easily available from narrative sources such as official documents, newspapers, TV and on the Internet. The coding scheme should be developed for this information. For example, negative numbers indicate conflict behavior between states (threats, military engagements); positive numbers indicate cooperation (economic aid, agreement). Then the coding scheme should be implemented in a specialized computer program, such as TABARI and all information should be fed into this program so that the machine could code it. Once the coding is done, produced results can be used for statistical analysis.
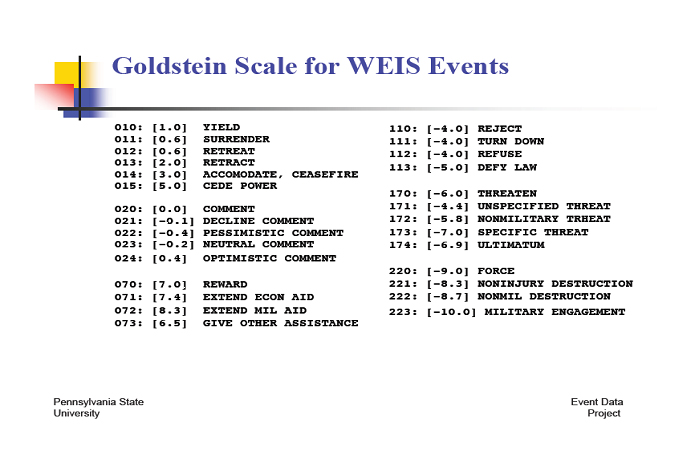
Example of coding scheme for events data analysis.
Is there anything that we should pay special attention to when using these models for analysis of the probability of armed conflict, say between Iran and Israel?
I think that in terms of the interaction between Iran and Israel you could use events data analysis - machine coded textual data with multi-equation time series models. This method was used for analysis of the Israeli-Palestinian conflict by a number of authors in the Journal of Conflict Resolution in the last three or four years.
In these models it is very important to incorporate simultaneity. You have to have a simultaneous multi-equation model, because what the Iranians do towards the Israelis is responded by the Israelis in a way that provokes further behavior by the Iranians towards the Israelis and vice versa. There is a natural kind of simultaneity that must be in the model.
Simultaneous Multi-Equation Model
Simultaneous multi-equation model is a system of stochastic difference equations, where equations jointly determine the evolution of the individual variables as the same variable appears in more than one equation: in other words, the equations jointly determine the evolution of the individual variables as the same variable appears in more than one equation: in other words, the equations interact.
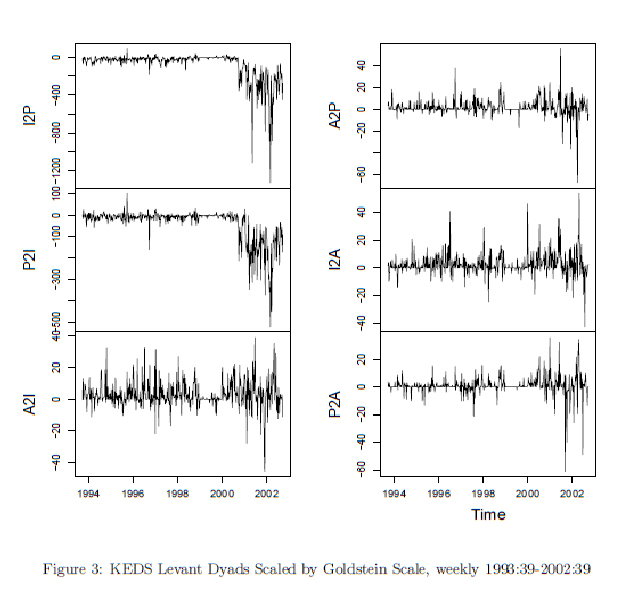
Event dataset for the Israeli-Palestinian Conflict, where I = Israel, P = Palestine, and A = U.S. (“A2I” is the U.S. actions toward the Israelis).
Source: www.utdallas.edu
How can we define dependent and independent variables in this case?
There are two answers to that. The first one is that - and this is what most of the American experts do – we need to study the verbal arguments very carefully trying to extract from them clear causal claims or claims of causal direction. The other one is that sometimes we use formal mathematical models that give us dependent (presumed effect) and independent (presumed cause) variables. So, the mathematical model will tell you what the independent and dependent variables are; and then they will transfer like that into a statistical model.
U.S. National Science Foundation funds the so called “EITM project” (Empirical Implications of Theoretical Models) that aims to get experts that work with mathematical models like game theory to collaborate with experts that work on statistical testing.
Two other quick comments: I think it is important here that one also considers the possibility of simultaneity: because sometimes there is no clear independent and dependent variable. For example, in cases like the conflict between the Iranians and the Israelis there is no clear independent variable – it is a simultaneous equation system. They are both dependent, they are both endogenous. Therefore a model that just treats one (say, Iran causes Israel without incorporating how Israel causes Iran) will just not capture the data generating process.
What computer software could be used for quantitative analysis?
We usually teach STATA which is the most commonly used computer software in the United States. But the people in our discipline that do the most sophisticated work are using R. As well there is a number of tailored programs for things like sampling for Markov chain Monte Carlo models that use WinBUGS and some other more highly stylized statistical computer packages, like C++ and others.
STATA is the most commonly program taught in the U.S. graduate school; R is used by more sophisticated workers and there is some more specialized work with advanced programs like WinBUGS.
Markov Chain Monte Carlo
Markov chain is a random process that has the property of memorylessness which means that the future position depends only on the current state of the process and not the past. Monte Carlo method is a set of instructions that randomly sample from some process under study. For example, this method was used to investigate the time series of violence in the Iraq conflict in order to prove that increasing violence can be contemporaneous with some important state-building events such as democratic elections.

Source: www.people.fas.harvard.edu
What types of errors should the researcher look out for when dealing with quantitative methodology?
I think the one I worked on the most is specification uncertainty which means not knowing the true functional form of the relationship. But there are many people doing good work on problems like measurement error - which is another very serious problem. Coming up with better measures for ideas like democracy is a very important project.
What are the special challenges of employing mixed methods, and can or should one mix methods?
I would argue that everybody uses mixed methods. Every single expert reads verbal argument and uses qualitative reasoning not just to formulate their model but also to interpret the results. But some people do this implicitly without being really systematic and open about it, as opposed to others who do it explicitly. I think the people that do it the best are the people that use Bayesian statistics. They are much more explicit about their beliefs, about specification and the like. Scholars like Jeff Gill from Washington University in St. Louis are really leading social scientists to try to be explicit and use Bayesian methods which make those qualitative-quantitative mixes clearer to everyone who reads their work.
What should the researcher keep in mind when interpreting quantitative data? What are the best interpreting technics?
The key concept is to be totally explicit about one’s assumptions and about how certain one is about the accuracy of those assumptions which introduce the Bayesian element in a more systematic way.
Nowadays you also have to prove to a much greater extent that your results are robust to different specifications and measures. 25 years ago in the United States you could just ran analysis and publish it. Nowadays when you submit something for peer-review in the United States people want to see that you results are hold up when you change measures, when you change functional form.
So, interpretations mean that you have to really care about and demonstrate the robustness of your findings to these different specification decisions.
What is the best way to present the outcome of the quantitative analysis?
I think the use of visual presentation is becoming more common and it is more useful. Big tables of quantitative results are increasingly difficult to digest or to understand. And people are developing very useful ways to represent result visually in terms of figures and diagrams. Visualization is going to come in to the fore in the coming years and it already has.
Mr. Freeman, thank you so much for the interview.
(no votes) |
(0 votes) |